Technology
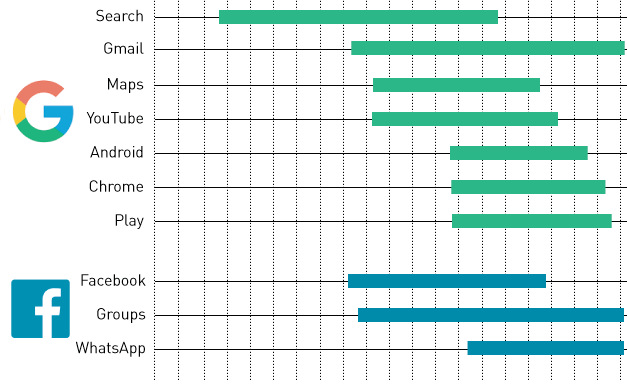
Timeline: The March to a Billion Users [Chart]
![Timeline: The March to a Billion Users [Chart]](https://www.visualcapitalist.com/wp-content/uploads/2016/02/the-race-to-1-billion-users-chart.png)
The March to a Billion Users
How long did it take for each app to hit the 1B mark?
The Chart of the Week is a weekly Visual Capitalist feature on Fridays.
With approximately 3.3 billion people now using the internet, how hard can it possibly be to reach one billion of them each month?
It turns out that it’s quite a challenge.
Apple, the largest company by market capitalization, doesn’t have a single product with that kind of penetration.
WeChat, which is the most popular mobile messaging app in China, couldn’t reach one billion active users even if it was used by every single person with a smartphone in China. That’s why the app “only” has 650 million active users right now.
Meanwhile, names such as Reddit, Twitter, Pinterest, and Instagram all boast hundreds of millions of users. However, none of these are able to yet have the global market penetration to reach the coveted billion mark.
The Big Three
So far, the only companies in possession of apps or programs with more than one billion active users are Google, Facebook, and Microsoft.
Amazingly, Google alone has seven of them: Search, Gmail, Maps, YouTube, Android, Chrome, and Play. The last of these to reach the one billion mark was Gmail, as per Alphabet’s announcement earlier this month during an earnings call.
Google also has the app that reached one billion users the quickest: Android did it in only 5.8 years.
Facebook also has three apps that can make the billion user claim. Facebook itself has the largest audience out of all of these apps, with 1.59 billion monthly active users. WhatsApp, which Facebook bought for $22 billion in October 2014, has also recently announced on its blog that it also surpassed the one billion user mark. This now fulfills a promise that Mark Zuckerberg made to Facebook shareholders at the deal’s outset.
Lastly, there’s Microsoft’s Windows and Office products, which are the only paid products that could crack the list. They took the longest to get there: 25.8 years and 21.7 years respectively.


Technology
Ranked: Semiconductor Companies by Industry Revenue Share
Nvidia is coming for Intel’s crown. Samsung is losing ground. AI is transforming the space. We break down revenue for semiconductor companies.


Semiconductor Companies by Industry Revenue Share
This was originally posted on our Voronoi app. Download the app for free on Apple or Android and discover incredible data-driven charts from a variety of trusted sources.
Did you know that some computer chips are now retailing for the price of a new BMW?
As computers invade nearly every sphere of life, so too have the chips that power them, raising the revenues of the businesses dedicated to designing them.
But how did various chipmakers measure against each other last year?
We rank the biggest semiconductor companies by their percentage share of the industry’s revenues in 2023, using data from Omdia research.
Which Chip Company Made the Most Money in 2023?
Market leader and industry-defining veteran Intel still holds the crown for the most revenue in the sector, crossing $50 billion in 2023, or 10% of the broader industry’s topline.
All is not well at Intel, however, with the company’s stock price down over 20% year-to-date after it revealed billion-dollar losses in its foundry business.
| Rank | Company | 2023 Revenue | % of Industry Revenue |
|---|---|---|---|
| 1 | Intel | $51B | 9.4% |
| 2 | NVIDIA | $49B | 9.0% |
| 3 | Samsung Electronics | $44B | 8.1% |
| 4 | Qualcomm | $31B | 5.7% |
| 5 | Broadcom | $28B | 5.2% |
| 6 | SK Hynix | $24B | 4.4% |
| 7 | AMD | $22B | 4.1% |
| 8 | Apple | $19B | 3.4% |
| 9 | Infineon Tech | $17B | 3.2% |
| 10 | STMicroelectronics | $17B | 3.2% |
| 11 | Texas Instruments | $17B | 3.1% |
| 12 | Micron Technology | $16B | 2.9% |
| 13 | MediaTek | $14B | 2.6% |
| 14 | NXP | $13B | 2.4% |
| 15 | Analog Devices | $12B | 2.2% |
| 16 | Renesas Electronics Corporation | $11B | 1.9% |
| 17 | Sony Semiconductor Solutions Corporation | $10B | 1.9% |
| 18 | Microchip Technology | $8B | 1.5% |
| 19 | Onsemi | $8B | 1.4% |
| 20 | KIOXIA Corporation | $7B | 1.3% |
| N/A | Others | $126B | 23.2% |
| N/A | Total | $545B | 100% |
Note: Figures are rounded. Totals and percentages may not sum to 100.
Meanwhile, Nvidia is very close to overtaking Intel, after declaring $49 billion of topline revenue for 2023. This is more than double its 2022 revenue ($21 billion), increasing its share of industry revenues to 9%.
Nvidia’s meteoric rise has gotten a huge thumbs-up from investors. It became a trillion dollar stock last year, and broke the single-day gain record for market capitalization this year.
Other chipmakers haven’t been as successful. Out of the top 20 semiconductor companies by revenue, 12 did not match their 2022 revenues, including big names like Intel, Samsung, and AMD.
The Many Different Types of Chipmakers
All of these companies may belong to the same industry, but they don’t focus on the same niche.
According to Investopedia, there are four major types of chips, depending on their functionality: microprocessors, memory chips, standard chips, and complex systems on a chip.
Nvidia’s core business was once GPUs for computers (graphics processing units), but in recent years this has drastically shifted towards microprocessors for analytics and AI.
These specialized chips seem to be where the majority of growth is occurring within the sector. For example, companies that are largely in the memory segment—Samsung, SK Hynix, and Micron Technology—saw peak revenues in the mid-2010s.

-

 Green2 weeks ago
Ranked: Top Countries by Total Forest Loss Since 2001
-

 Travel1 week ago
Ranked: The World’s Top Flight Routes, by Revenue
-

 Technology2 weeks ago
Ranked: Semiconductor Companies by Industry Revenue Share
-

 Money2 weeks ago
Which States Have the Highest Minimum Wage in America?
-

 Real Estate2 weeks ago
Ranked: The Most Valuable Housing Markets in America
-

 Markets2 weeks ago
Charted: Big Four Market Share by S&P 500 Audits
-

 AI2 weeks ago
The Stock Performance of U.S. Chipmakers So Far in 2024
-

 Automotive2 weeks ago
Almost Every EV Stock is Down After Q1 2024